An Allocation Profiler for OCaml Bytecode Interpreter
23 Sep 2015This post describes a simple flat allocation profiler for OCaml 4.02 bytecode interpreter.
OCaml is a strongly typed functional language with automatic memory management. Automatic memory management alleviates the need to manually deal with memory memory management, and by construction, avoids a large class of bugs. However, abstractions are not free in OCaml. Unlike MLton, a whole-program optimizing Standard ML compiler, which I used to hack on in an earlier life, in OCaml, one needs to be particularly aware of the cost of introducing abstractions such as higher-order functions and modules. This is often at odds with desirable programming patterns one tends to embrace in a higher-order modular functional language. Writing performance sensitive code in OCaml remains a skill that is acquired gradually through experience.
There are of course, excellent
resources
available
to understand the performance implications of OCaml abstractions. However,
often times, I simply need a way to profile and uncover performance bottlenecks
in my program, before I can apply any targeted optimizations. Profiling along
the following three axes are particularly useful: time, counts and
allocations. OCaml has good support for two of
these. While ocamlcp
with ocamlprof gives you count profile, one can use the standard Unix
profiler gprof for time profiling. However, these do not necessarily help
with identifying the cost of abstractions, for which one needs an allocation
profiler1.
The state of allocation profiling in OCaml
While allocation profiler is not part of the standard OCaml distribution,
several alternatives do exist. Memprof from
OCamlPro provides “non-intrusive memory profiler
for OCaml applications”, with a simple online version and a commercial version
with fine-grained tracing. Mark Shinwell has an allocation profiler for OCaml
4.02 native
code programs generated by ocamlopt. Unfortunately, neither of these options
were suitable for me as the Multicore
OCaml currently only supports
bytecode compilation, and has a
markedly
different
GC. So I decided to implement my
own for the multicore
compiler.
Since the allocation profiler will be useful in general, I have also ported it
to OCaml 4.02.
This post talks about the vanilla OCaml allocation profiler.
Bytecode allocation profiler
The idea of this allocation profiler is to record the allocations and associate them with the position in the code where the corresponding block or closure was allocated. In particular, we do not record the call stack that led to the allocation point, which would have provided us a more accurate picture. One can get pretty far with just the flat profile. Running the bytecode program under the modified interpreter produces a profile, which is then analyzed offline.
The bytecode interpreter of OCaml is remarkably simple, as is the patch for the allocation profiler. In this section, I will detail the implementation of the profiler. If you are interested in just using the profiler, do skip right to the instructions.
When the bytecode is loaded by the interpreter in
caml_load_code,
it allocates an array for the bytecode. caml_start_code points to the start
of this array. The program counter
pc
is a pointer into this array. We maintain a distinct code pointer
profile_pc
that always points to the instruction and never its operands. The offset of
profile_pc from caml_start_code uniquely identifies a instruction in the
bytecode executable. We will use this offset to record the allocation points.
We allocate an array
caml_profile_counts
of unsigned integers whose length is equal to the length of the code, into
which we will store the allocation counts. There are two main ways in which
OCaml allocates memory;
Alloc_small
for allocating in minor heap, and
caml_alloc_shr
for allocating in major heap. We modify both to record the allocations at a
given instruction. We modify
interp.c
to update profile_pc for instructions which potentially allocate. Allocations
for arrays and strings are performed in their corresponding C functions through
caml_alloc.
Such allocations are covered by recording the instruction in
Setup_for_c_call.
caml_alloc_shr is also used by the GC for promoting live minor heap objects
to major heap at the end of a minor GC cycle. Allocations by GC is ignored by
resetting profile_pc to NULL before minor collections. Hence, the profiler
only counts allocations by the mutator. Finally, the interpreter outputs the
profile
at the end of execution of the program.
#Using the profiler
In order to use the profiler, compile the OCaml programs with the bytecode
compiler ocamlc with -g option to record the debugging information. This
will be used to interpret the profile. When using ocamlbuild it is necessary
to compile and link with -g (with -cflag -g -lflag -g).
First, get OCaml 4.02 with the allocation profiler, and build it using
opam-compiler-conf:
$ git clone https://github.com/kayceesrk/ocaml
$ cd ocaml
$ git checkout 4.02-profile-alloc
$ opam compiler-conf configure
$ make world.opt
$ opam compiler-conf install
Let us profile the Eight
Queens
program. Profiling is enabled by setting the CAML_PROFILE_ALLOC to the output
filename of the profile.
$ wget http://caml.inria.fr/pub/old_caml_site/Examples/oc/basics/queens.ml
$ ocamlc -o queens -g queens.ml
$ CAML_PROFILE_ALLOC=queens.preprof ./queens
Chess boards's size ? 8
The 8 queens problem has 92 solutions.

Do you want to see the solutions <n/y> ? n
$ ./tools/allocprof queens.preprof > queens.prof
$ head -n5 queens.prof
Total: 80,433 words
Instr   Words   % of total
-----   -----   ----------
2488    31440   39.09%
27681   31440   39.09%
allocprof is a small python script that post-processes the profile. The
post-processed profile shows the total number of words allocated, and is
followed by the instruction number, words allocated and the percentage of total
allocation that it represents. The instruction number can be linked back to the
source code by dumping the bytecode executable with dumpobj.
$ ./tools/dumpobj queens > queens.dumpobj
$ vim queens.prof queens.dump queens.ml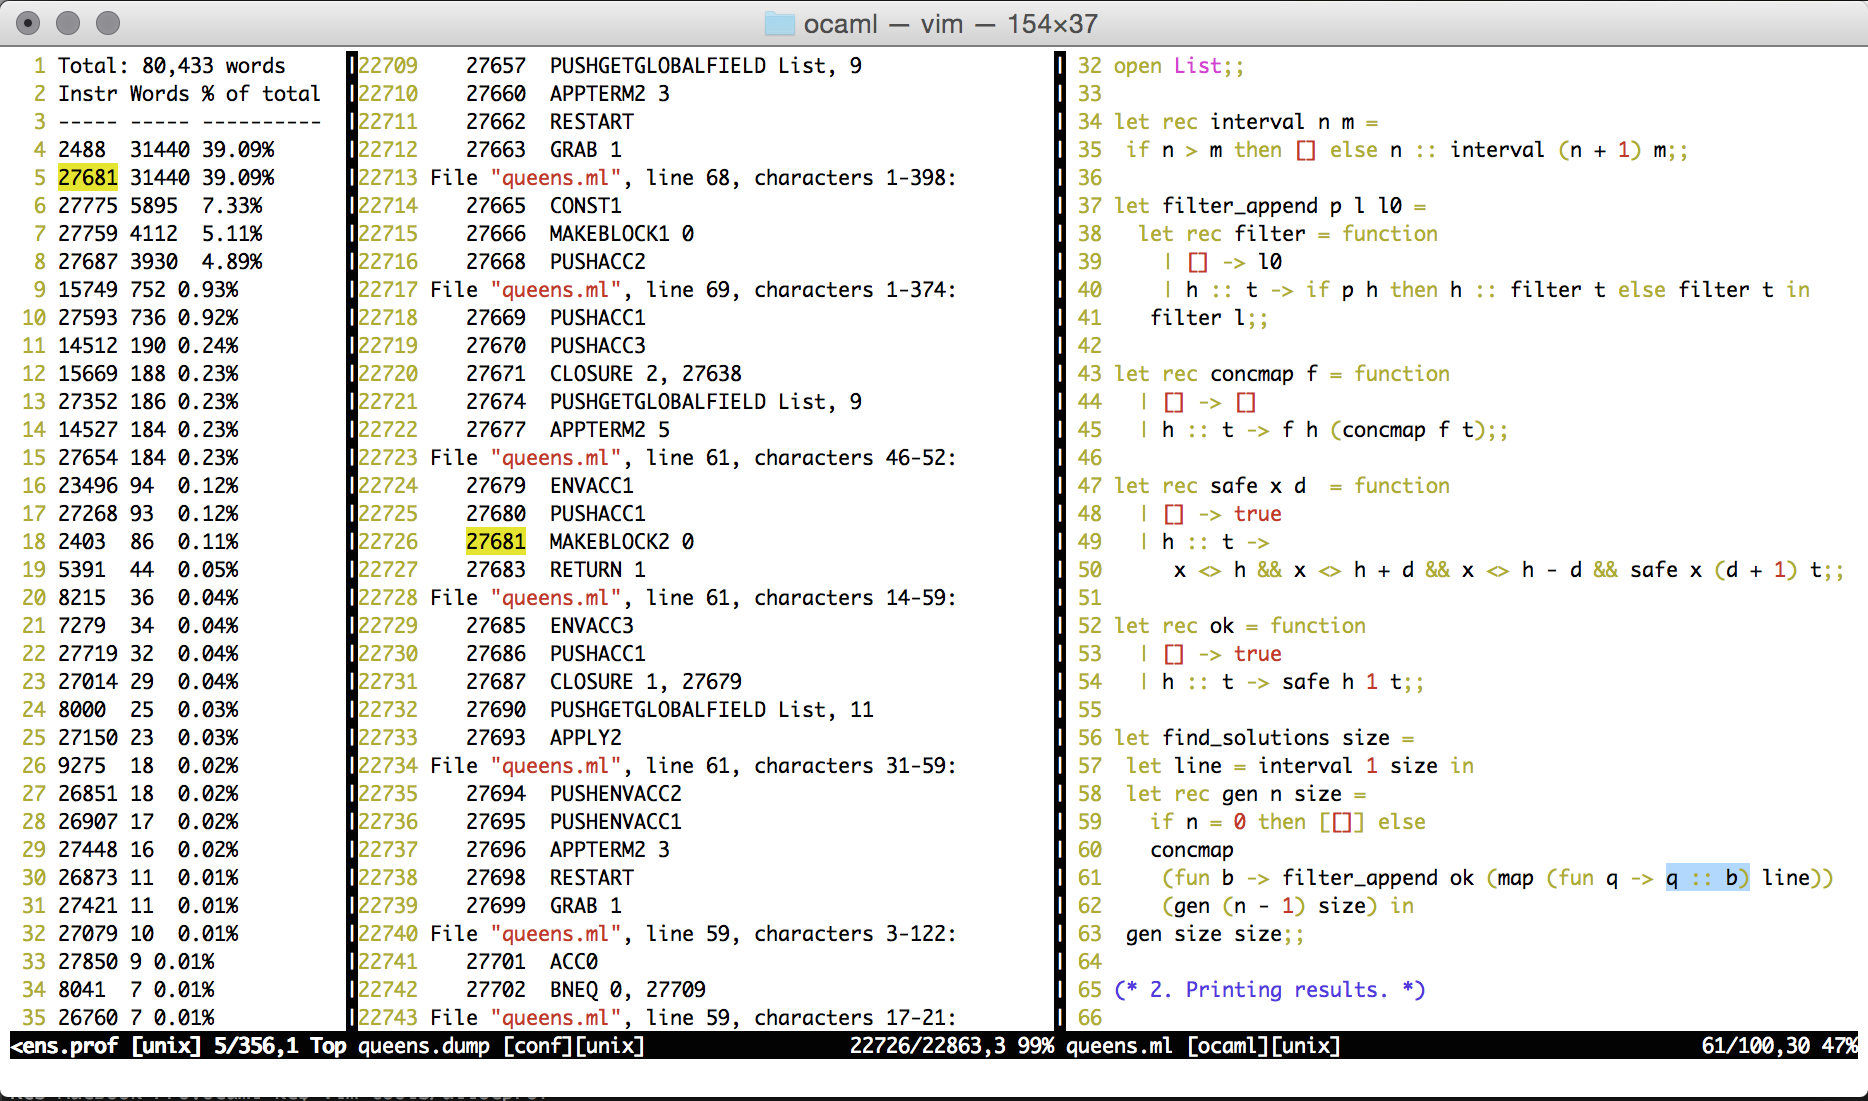
We can see that the program spent 39.09% of allocations for appending to lists
in queens.ml line 61. For the curious, the other 39.09% was spent in
List.map function.
Dealing with early termination
The profiler normally writes out the profile at the end of the standard program
termination, when the interpreter has run to completion. However, programs may
terminate early by explicitly invoking exit. In such cases, the runtime does
not get a chance to output the profile. Hence, a function output_profile: unit
-> unit is provided to explicitly request the profile to be written out to the
filename provided in CAML_PROFILE_ALLOC. The following example illustrates
the use case in a program that uses the Async library:
(* foo.ml *)
open Core.Std
open Async.Std

let main () =
  printf "Hello!\n";
  (* Without this call, profile isn't written out *)
  output_profile ();
  return ()

let () =
  Command.async_basic
    ~summary:"foo"
    Command.Spec.(empty)
    main
  |> Command.run
The program is compiled and run as follows:
$ ocamlbuild -use-ocamlfind foo.byte -package core -package async -tag thread -tag debug
Finished, 3 targets (0 cached) in 00:00:00.
$ CAML_PROFILE_ALLOC=foo.preprof ./foo.byte
Hello!
$ ls foo.preprof
foo.preprof
Thanks to trevorsummerssmith for the motivation and the example.
Conclusion
The allocation profiler has been quite useful for optimizing small programs. It would be interesting to see whether it scales to larger ones. Also, here is my (non-exhaustive) wish list of features:
- Improve tooling. Avoid the need to manually search through text files.
- Record stack allocation. This is especially important in multicore OCaml since stacks are heap allocated.
- Record the call stack information for allocations to get an informative profile.
- Dump the profile every few milliseconds to study the allocation behavior of programs over time.
- Save the location information in the object header and dump the heap at every GC to catch space leaks.
-
Profiling for time does give you the time that the program spends in garbage collection functions such as minor GC cycles and major GC slices, but are not helpful for pinpointing allocation bottlenecks. ↩
