Getting Started with GDB on OCaml
20 Jan 2024A number of folks who regularly use OCaml were surprised to learn that you can reasonably debug OCaml programs using gdb. The aim of the post is to show the first steps in using gdb on OCaml programs.
Let’s consider the following program:
(* fib.ml *)
let rec fib n =
  if n = 0 then 0
  else if n = 1 then 1
  else fib (n-1) + fib (n-2)

let main () =
  let r = fib 20 in
  Printf.printf "fib(20) = %d" r

let _ = main ()
Let’s compile this program. I’m using OCaml version 5.1.1.
$ ocamlopt --version
5.1.1
$ ocamlopt -g -o fib.exe fib.ml
$ $ ./fib.exe 20
fib(20) = 6765
As you can see, the program prints the 20th Fibonacci number. Let’s examine this program under gdb. Before we venture any further, I highly recommend watching this 15-minute video that shows a number of gdb tricks. Let’s start a gdb session.
$ gdb ./fib.exe
Setting breakpoints
Let’s set a break point at the fib function. When OCaml functions are
compiled, their names are mangled. OCaml 5.1.1 uses the following mangling
scheme caml<MODULE_NAME>.<FUNCTION_NAME>_<NNN> where NNN is a randomly
generated number. For the fib function, since it is under the file fib.ml,
the module name is Fib. Since we can’t guess NNN, we use tab completion to
help identify the function.
(gdb) break camlFib.fib_ #press tab
(gdb) break camlFib.fib_269 #269 happens to be the randomly generated number
                            #on my machine.
(gdb) Breakpoint 1 at 0x3d160: file fib.ml, line 1.
You can also set a breakpoint using gdb’s file name and line number combination.
Let’s set another break point at the main function, which is at line number 6
in fib.ml.
(gdb) break fib.ml:6
Breakpoint 2 at 0x3d1d0: file fib.ml, line 6.
Let’s run the program.
(gdb) r
Starting program: /home/kc/temp/fib.exe
[Thread debugging using libthread_db enabled]
Using host libthread_db library "/lib/x86_64-linux-gnu/libthread_db.so.1".

Breakpoint 2, camlFib.main_271 () at fib.ml:6
6       let main () =
The program execution starts in the gdb session and we stop at the breakpoint
installed at main. gdb has a nice TUI mode for stepping through the file. This
can be activated with ctrl+x+a key combination, which should show a screen
similar to the following.
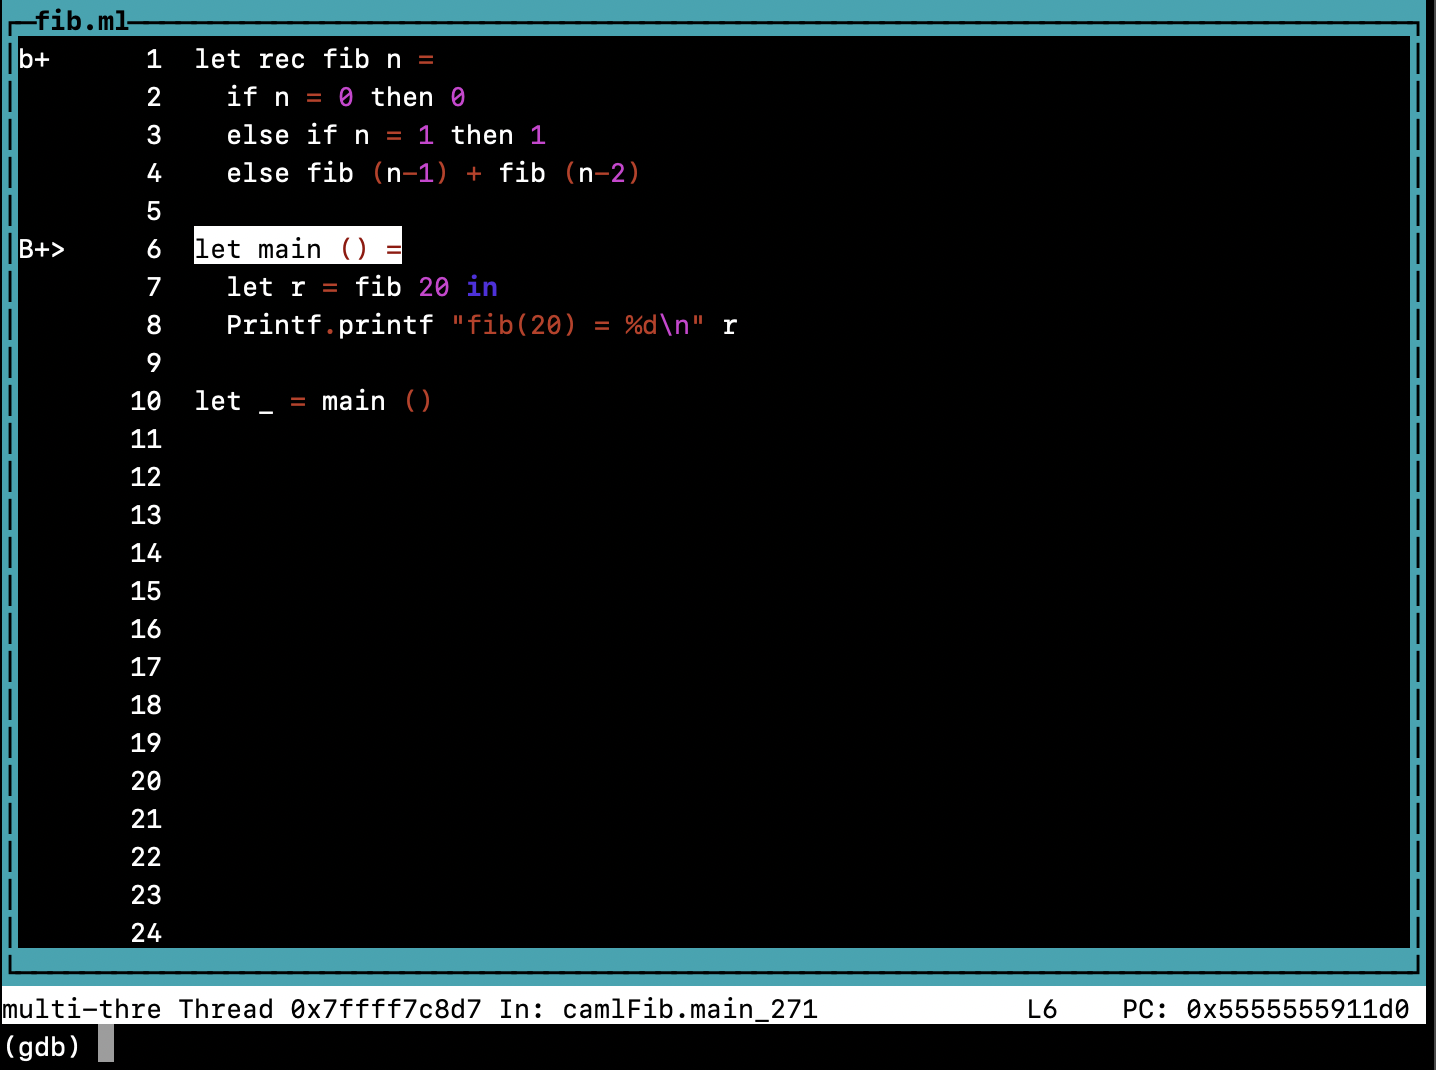
Notice that we can see both the breakpoints installed in this file. The current line is highlighted.
Examining the stack
You can step through the OCaml program with gdb commands n and s. After a
few ns, you can examine the backtrace using the bt command.
(gdb) bt
#0  camlFib.fib_269 () at fib.ml:1
#1  0x00005555555911a1 in camlFib.fib_269 () at fib.ml:4
#2  0x00005555555911a1 in camlFib.fib_269 () at fib.ml:4
#3  0x00005555555911a1 in camlFib.fib_269 () at fib.ml:4
#4  0x00005555555911a1 in camlFib.fib_269 () at fib.ml:4
#5  0x00005555555911f1 in camlFib.main_271 () at fib.ml:7
#6  0x000055555559129a in camlFib.entry () at fib.ml:10
#7  0x000055555558eb0b in caml_program ()
#8  <signal handler called>
#9  0x00005555555dd306 in caml_startup_common (pooling=<optimised out>, argv=0x7fffffffe008) at runtime/startup_nat.c:132
#10 caml_startup_common (argv=0x7fffffffe008, pooling=<optimised out>) at runtime/startup_nat.c:88
#11 0x00005555555dd37f in caml_startup_exn (argv=<optimised out>) at runtime/startup_nat.c:139
#12 caml_startup (argv=<optimised out>) at runtime/startup_nat.c:144
#13 caml_main (argv=<optimised out>) at runtime/startup_nat.c:151
#14 0x000055555558e8f2 in main (argc=<optimised out>, argv=<optimised out>) at runtime/main.c:37
As you can see the backtrace includes the recursive calls to the fib function,
the main function in fib.ml, followed by a number of functions from the
OCaml runtime, and finally ending at the main function.
Note that <signal handler called> is a misnomer and is not an actual signal
handler. OCaml 5 supports effect
handlers with the help of runtime
managed stack segments for the OCaml stack. There is also a single C stack that
is used by all the fibers that run on a
domain, our unit of parallelism.
The <signal handler called> represents a frame where the control switches
between the C stack (managed by the OS) and the OCaml stack (managed by the
OCaml runtime). The OCaml runtime marks these frames where the stack are split
as signal handler frames so that gdb doesn’t complain about stack corruption;
gdb expects stacks to grow down, which may not be true if the stack segments are
in different parts of the memory address space. You will also find such <signal
handler called> frames between OCaml fibers (when using effect handlers) and
when OCaml calls into the (C) runtime. You can find more details about the stack
layout in the PLDI 2021 paper on OCaml effect
handlers.
Examining values
There isn’t good support for examining OCaml values in gdb unlike C. That said,
given the uniform value representation of
OCaml, with a bit of
information about the OCaml calling convention, we can start to examine the
values. It is useful to note that OCaml 5.1.1 on x86 passes the first 10
arguments in
registers.
In particular, the first argument is in the register rax. So the argument to
the fib function should be in the rax register. We also know that the
argument to fib is an integer. OCaml uses 63-bit tagged integers (on 64-bit
machines) with the least-significant bit is 1. Given a machine word or a
register holding an OCaml integer, the integer value is obtained by right
shifting the value by 1.
Putting it all together, we can get the argument value of fib at the
breakpoint at the entry to fib as follows:
(gdb) p $rax >> 1
$2 = 12
Given that we’ve already stepped through the program several times, the current
call for me corresponds to fib(12). Let’s see what’s the next argument by
continuing the program until we hit the breakpoint again.
(gdb) c
Continuing.

Breakpoint 1, camlFib.fib_269 () at fib.ml:1
(gdb) p $rax >> 1
$3 = 10
Observe that this corresponds to the recursive call fib(10), which must mean
that the RHS recursive call is the one being invoked. Note that the evaluation
order of arguments in OCaml is unspecified. The 5.1.1 implementation does
right-to-left evaluation of arguments (to the (+) function in this case),
which can be confirmed with the following program:
$ cat eval_order.ml
let _ =
  (print_endline "hello"; 0) + (print_endline "world"; 1)
$ ocamlopt.opt -g -o eval_order.exe eval_order.ml
$ ./eval_order.exe
world
hello
Advanced printing
As you can observe, examining values this way is cumbersome. The OCaml compiler distribution has some rudimentary scripts to make it easier to examine OCaml values in gdb. Note that this was developed by OCaml maintainers to develop the compiler, and was not designed to serve end user needs. That said, let’s dive in.
Since we are on OCaml 5.1.1, let’s check out the source code for 5.1.1 first.
# I'm in ~/repos directory on my machine *)
$ git clone https://github.com/ocaml/ocaml --branch 5.1.1
Let’s start a new gdb session, load the gdb script and get to the desired breakpoint.
$ gdb ./fib.exe
(gdb) source ~/repos/ocaml/tools/gdb_ocamlrun.py
(gdb) break fib.ml:1
Breakpoint 1 at 0x3d160: file fib.ml, line 1.
(gdb) r
Starting program: /home/kc/temp/fib.exe
[Thread debugging using libthread_db enabled]
Using host libthread_db library "/lib/x86_64-linux-gnu/libthread_db.so.1".

Breakpoint 1, camlFib.fib_269 () at fib.ml:1
1       let rec fib n =
As earlier, the first argument is in rax register. We can examine the value
now with the help of the script.
(gdb) p (value)$rax
$1 = I(20)
value is the type of OCaml values defined in OCaml runtime. The script
tools/gdb_ocamlrun.py installs a pretty printer for the values of type
value. Here, it prints that the argument is the integer 20.
We can also print other kinds of OCaml values. In order to illustrate this, consider the following program:
$ cat test_blocks.ml
(* test_blocks.ml *)

type t = {s : string; i : int}

let main a b =
  print_endline "Hello, world!";
  print_endline a;
  print_endline b.s

let _ = main "foo" {s = "bar"; i = 42}
Let’s compile, start a gdb session and break at the main function.
$ ocamlopt -g -o test_blocks.exe test_blocks.ml
$ gdb ./test_blocks.exe
(gdb) break camlTest_blocks.main_272
Breakpoint 1 at 0x16ed0: file test_blocks.ml, line 5.
(gdb) r
Starting program: /home/kc/temp/test_blocks.exe
[Thread debugging using libthread_db enabled]
Using host libthread_db library "/lib/x86_64-linux-gnu/libthread_db.so.1".

Breakpoint 1, camlTest_blocks.main_272 () at test_blocks.ml:5
5       let main a b =
(gdb) source ~/repos/ocaml/tools/gdb_ocamlrun.py
Let’s examine the two arguments to main.
(gdb) p (value)$rax
$1 = String_tag("foo", NOT_MARKABLE)
The first argument is a string “foo”. NOT_MARKABLE is one of the GC colours
used by OCaml 5, and represents objects that are not traced by the
mark-and-sweep (major) GC. The string happens to be allocated in the data
section of the address space, and
is not traced by the GC.
(gdb) info symbol $rax
camlTest_blocks.4 in section .data of /home/kc/temp/test_blocks.exe
Let’s examine the second argument.
(gdb) p (value)$rbx
$2 = Block(0, wosize=2, NOT_MARKABLE)
The second argument, which is passed in the register rbx, is a record with two
fields. Hence, the pretty printer says that it is a block with 2 fields. We can
print both values using gdb’s support for printing a range of values.
(gdb) p *(value*)$rbx@2
$3 = {String_tag("bar", NOT_MARKABLE), I(42)}
We cast rbx to an array of values and print the first two fields in the
array. This shows that the fields are the string “bar” and integer 42.
More for later
There is a lot more to be said about debugging OCaml programs using gdb. We shall see them in subsequent posts if there is interest.
